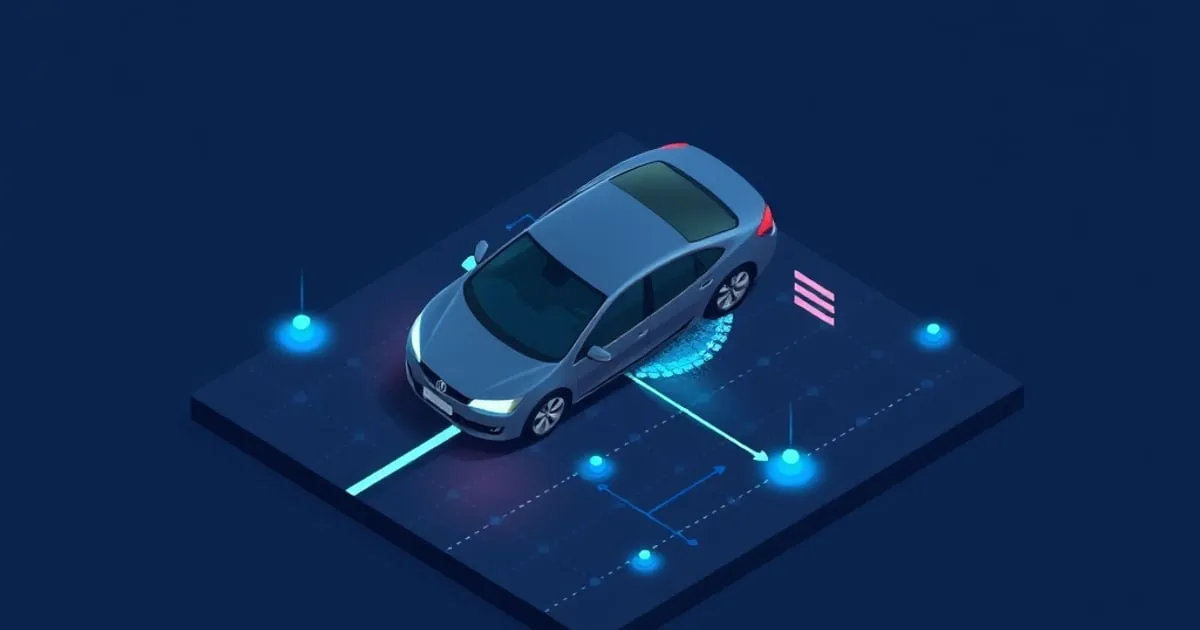
Self-Driving Car Accident Causes: What Crash Data Shows
Sensor failures, software edge cases and fault attribution behind self-driving car accident causes, plus what NHTSA Standing General Order data shows.
Self-driving car accident causes fall into three categories that the popular press routinely conflates: sensor and perception failures, software edge cases, and third-party behavior the system failed to anticipate. Understanding which category actually dominates changes how you assess the technology’s safety trajectory — and which incidents are genuine regression signals versus expected statistical noise in a growing fleet.
The dataset everything below rests on is NHTSA’s Standing General Order on Crash Reporting. Standing General Order 2021-01, issued 29 June 2021 and amended since, obliges manufacturers and operators to report crashes in which a Level 2 ADAS or a Level 3-5 ADS was engaged within 30 seconds of impact, and NHTSA republishes the incident files monthly. NHTSA does not publish a headline tally, so the counts quoted in this article come from a third-party analysis of those releases covering the period to November 2025 — roughly 5,200 reported incidents. Treat that figure as an aggregation of the SGO files rather than an official total, and pull the current CSVs from NHTSA if the exact count matters.
A separate academic analysis of more than 3.9 million miles of autonomous-vehicle testing collected between 2014 and 2022 found that around 90% of incidents occurring while a vehicle was in autonomous mode were caused by other road users rather than the AV system itself.
That ratio shifts significantly when you isolate technical-failure incidents, which is where the safety-engineering story lives.
Sensor Failures: The Hardest Technical Problem
Autonomous vehicle perception stacks rely on three primary sensing modalities: cameras, LiDAR (light detection and ranging), and radar. Each carries failure modes that are well-documented and not yet fully solved.
Camera failures are the most common because cameras are the highest-density sensor in most production stacks. A 2024 survey of 108 publications on autonomous vehicle sensor failures, published in Sensors (MDPI), catalogs the failure taxonomy: brightness saturation, motion blur, broken or dirty lenses, lens flare, rain occlusion, condensation, dead pixels, banding artifacts, and chromatic aberration. When a camera produces degraded imagery, downstream AI/ML systems can misclassify objects, miss pedestrians, or generate phantom obstacles. Phantom braking events in Tesla’s ADAS fleet trace to exactly this failure mode: a camera artifact interpreted as a stopped vehicle.
LiDAR failures are condition-dependent. The laser pulses that generate a point cloud scatter in fog, rain, and snow, degrading range accuracy and object detection confidence. Mirror-like reflective surfaces — wet roads, highly polished vehicles, some road markings — cause complete reflection of laser beams, leaving blind regions in the point cloud. At 110 km/h (about 68 mph) a 50-millisecond blind region is roughly a 1.5-metre gap in perception; a full 3-metre gap needs about 216 km/h, so the highway-speed number is smaller than it is often quoted as, and still enough to matter at closing speeds.
Radar failures produce a different signature. Frequency-modulated continuous-wave (FMCW) radar, now standard on most production systems, generates interference patterns when multiple vehicles equipped with the same technology operate in proximity. Angular ambiguities — signals that cannot be resolved to a single target direction — can appear as spurious objects. The sensor fusion layer is supposed to discard these, but edge cases where radar ghosts are reinforced by camera artifacts have contributed to confirmed incidents.
GNSS vulnerability is a separate vector. Jamming and spoofing of GPS signals can place a vehicle at incorrect map coordinates, disrupting route planning and potentially map-based localization systems. This is an active area of research in adversarial AV testing.
The dawn and dusk problem cuts across all three modalities: AV crashes are reported to occur at roughly 5.25 times the rate during low-light transition periods compared to fully lit conditions, because camera exposure is transitioning, LiDAR signal-to-noise is challenged by forward scatter, and radar provides no compensating advantage for the specific object-classification tasks that fail.
Software and Operational Edge Cases
Hardware accounts for a fraction of the incident picture. Analysis of California’s Autonomous Vehicle Tester Program disengagement reports — covering 36 operators from September 2014 through November 2018 — found that 25.7% of disengagements were attributed to software and hardware issues combined. Disengagements are the safety-driver takeovers that happen before an incident; they are the leading indicator.
The software failure taxonomy includes:
- Unclassified object handling: production models trained on specific object classes (cars, trucks, pedestrians, cyclists) perform poorly on atypical objects — debris, animals, unusual vehicle configurations, emergency scenes with flares and cones that alter lane geometry.
- Prediction failure: even when an object is correctly classified, the trajectory prediction model may assign low probability to the actual future path. A pedestrian stepping off a curb at a non-crosswalk location may be classified correctly but predicted to remain on the sidewalk.
- Map and HD-map drift: systems that rely on high-definition pre-mapped road geometry can fail when the physical world diverges from the map — construction zones, temporary lane closures, moved road furniture.
- ODD boundary violations: every AV deployment carries an operational design domain (ODD) — defined conditions of weather, speed, road type, and geography within which the system is certified. Incidents spike when vehicles operate at or beyond ODD boundaries, either through system error or operator override.
In the same third-party tally of the SGO files through November 2025, autonomous vehicles were found solely at fault in only about 4% of collisions involving other road users, and hardware or software failure accounted for roughly 8% of the incidents where the AV was judged at fault. These are small proportions, and the reported count has climbed year over year — a few hundred incidents in 2021 against roughly 1,800 through November 2025 — which mostly reflects fleet growth and the widening scope of mandatory reporting rather than a collapse in system safety. Because the denominator (miles driven per operator) is not in the SGO data, none of these figures is a crash rate.
Fault Attribution and What It Reveals
Tesla (about 2,700 reported incidents in that tally) and Waymo (about 1,400) account for the bulk of the dataset, but they represent fundamentally different system types. Tesla’s incidents are ADAS (Level 2, driver-in-the-loop), while Waymo’s are ADS (Level 4, no human fallback). Comparing their raw incident counts without normalizing for miles driven, system type, and operating geography produces misleading conclusions.
Geographic concentration matters too: San Francisco alone accounts for the largest single-city share of reported incidents, ahead of Los Angeles and Phoenix. Urban density, pedestrian volume, and complex intersection geometry drive incident rates up — which is also where autonomous taxi deployment is heaviest.
The fault attribution data points to a consistent engineering priority: the dominant causes of self-driving car accidents are not internal system failures but failures to safely handle external actors behaving unexpectedly. Enhancing defensive capabilities — earlier detection of erratic behavior, conservative gap acceptance at intersections, graceful handling of sensor edge cases — is where the safety delta is. Regulatory frameworks tracking these failure modes, including NHTSA’s SGO and the EU AI Act’s provisions on high-risk AI systems, are evolving to require more granular disclosure of root-cause categories rather than just incident occurrence.
Related on this site
The reason this dataset exists at all is that reporting is mandatory here and voluntary almost everywhere else in AI. NHTSA’s Standing General Order sits alongside the EU AI Act, GDPR and SEC clocks in AI incident reporting requirements, which covers who has to be told about an AI failure and how fast. For AI harms that reached court rather than a regulator, see real world AI failure examples that triggered lawsuits, and for how the response differs when the failing component is a model rather than a patchable service, see the incident-response playbook for AI systems.
Individual vehicle-automation incidents in our own catalog are dated on the day of the crash rather than the day of disclosure, and filterable by harm domain and source tier in the AI Incident Explorer.
Related across the network
Deliberate attacks on the perception stack are a separate failure class from the accidental ones above, but they hit the same sensors:
- Adversarial Patch Attacks: Physical Perturbations That Fool ML — adversarialml.dev
- Adversarial Examples Against Vision Models in 2026 — aiattacks.dev
Sources
- Standing General Order on Crash Reporting (NHTSA)
- Standing General Order 2021-01 (NHTSA, 29 June 2021)
- Data Analysis: Self-Driving Car Accidents 2019–2024 (Craft Law Firm) — third-party tally of the SGO releases
- A Survey on Sensor Failures in Autonomous Vehicles: Challenges and Solutions (MDPI Sensors 2024)
- Safety Challenges and Analysis of Autonomous Electric Vehicle Development: Insights from On-Road Testing and Accident Reports (arXiv 2305.12665)
AI Incidents — in your inbox
AI incidents, model failures, and adversarial-use cases — dated and sourced — delivered when there's something worth your inbox.
No spam. Unsubscribe anytime.
Related

Real World AI Failure Examples That Triggered Lawsuits
Real world AI failure examples, from a wrongful arrest in Detroit to a chatbot advising glue on pizza, and the court rulings and lessons they produced.

AI Incident Database Comparison: Which One to Use
AIID, OECD AIM, AIAAIC, AVID and MITRE ATLAS all answer to the name AI incident database. What each one records, and which to reach for when.

AI Incident Reporting Requirements: Who to Notify
One AI incident can start four legal clocks at once. The EU AI Act, GDPR, SEC and sector regulators each want a different notice on a different deadline.